Annual Report · First Edition · Methodology · Download PDF · Verified 2026-05-29
Virginia Criminal Court Outcomes
278,950 cases filed January 1 – December 31, 2025, across 125 jurisdictions
This report analyzes 278,950 criminal cases — misdemeanors and felonies across 26 named charge categories — filed in Virginia's district and circuit courts during calendar year 2025. Of the 190,783 that reached a final disposition, 46.0% did not result in conviction.
Published by VirginiaCourtFile.com from public Virginia court records. Methodology updated 2026-05-14 to enforce a strict 2025-filing filter at the data layer; every statistic re-derivable from the source data via methodology.
The data is drawn from the same public case information system used by attorneys, clerks, and the courts. Every number in this report is derived from that source. Where the data does not support a conclusion, we say so.
The report covers misdemeanor and felony criminal cases filed in 2025 — not traffic infractions, not the catch-all "Other" category, and not failure-to-appear warrants. What remains is 278,950 cases where a defendant faced a specific criminal allegation under a specific Virginia Code section.
Eight findings follow.
In this report
- Nearly half of resolved criminal cases do not result in conviction
- Charge type is the strongest predictor of dismissal rate in this data
- Felonies are dismissed at higher rates than misdemeanors
- In circuit court, 87.5% of convictions are guilty pleas
- In circuit court, acquittal rates at trial vary dramatically by charge
- Some courts are prosecutor-driven; others are judge-driven
- Jurisdictional variation spans a 7:1 range
- Demographics of the charged population
1. Nearly half of resolved criminal cases do not result in conviction
Of 190,783 criminal cases that reached a final disposition in 2025:
- 28.6% ended in nolle prosequi — the Commonwealth's Attorney declined to proceed
- 15.0% were dismissed by the court
- 2.4% resulted in acquittal
- 54.0% resulted in conviction
The 46.0% non-conviction rate is a statewide aggregate. It varies substantially by charge type (from 13.9% for DUI to 79.4% for kidnapping/abduction), by court level (42.5% for misdemeanors, 59.1% for felonies), and by jurisdiction (from 6.7% to 67.1% across courts with 500+ resolved cases). Each of those dimensions is examined below.
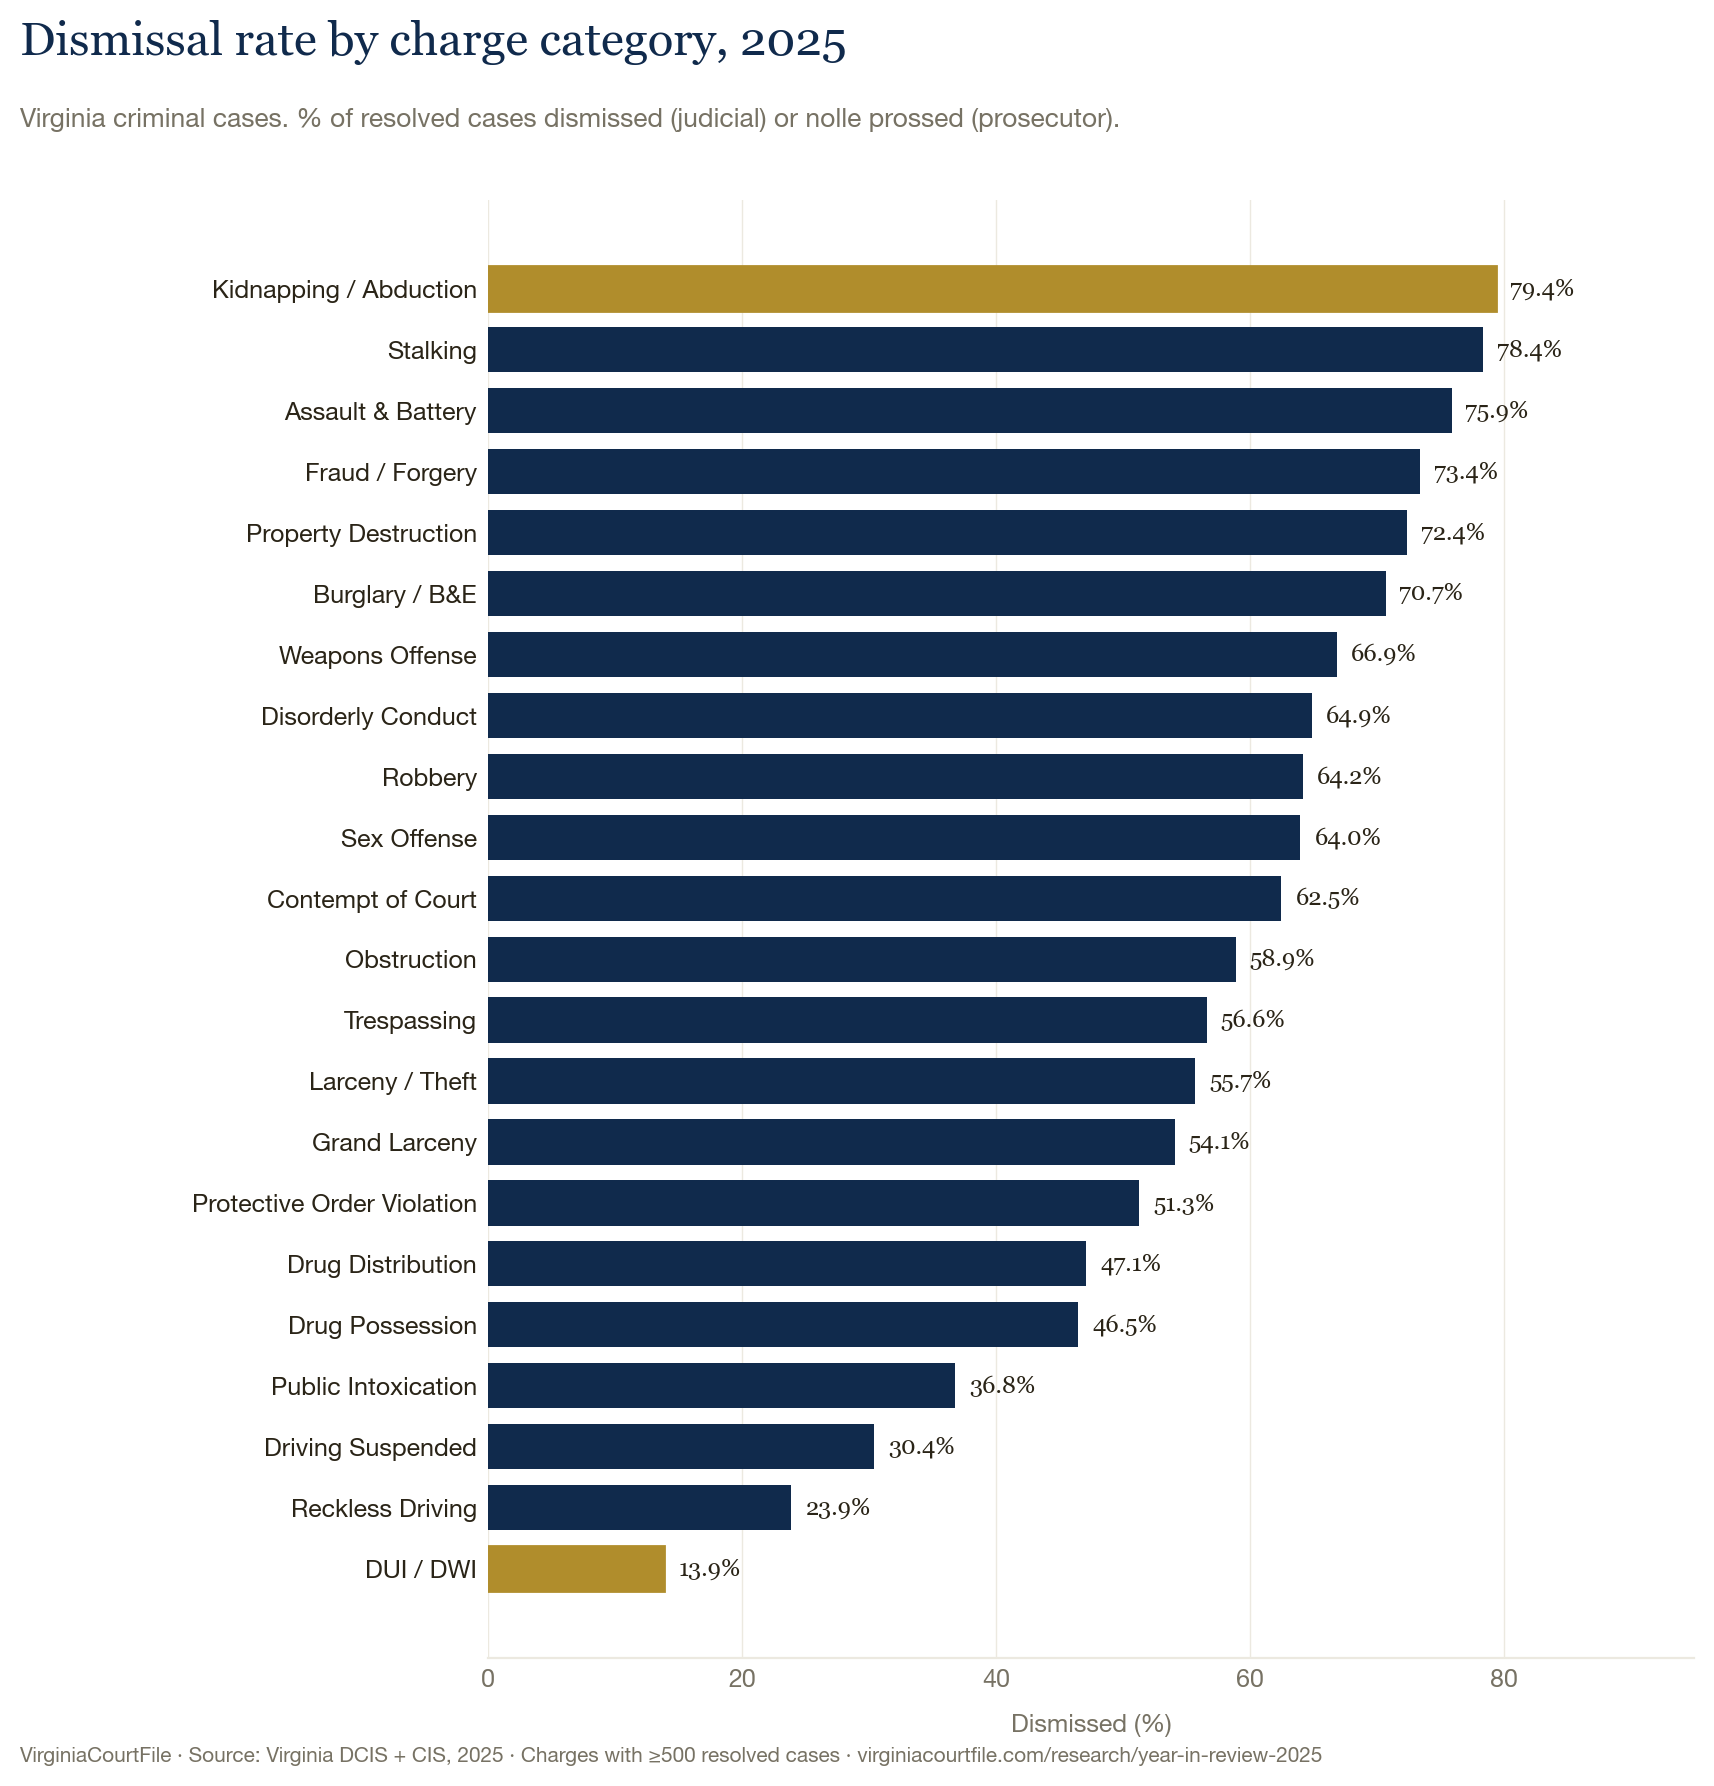
2. Charge type is the strongest predictor of dismissal rate in this data
| Charge | Cases | Resolved | Dismissed | Reduced |
|---|---|---|---|---|
| Kidnapping / Abduction | 1,730 | 986 | 7.1% | |
| Stalking | 1,072 | 791 | 2.1% | |
| Assault & Battery | 19,153 | 13,856 | 2.4% | |
| Fraud / Forgery | 8,183 | 4,357 | 4.8% | |
| Property Destruction | 7,925 | 5,266 | 5.8% | |
| Burglary / B&E | 2,102 | 995 | 7.4% | |
| Weapons Offense | 23,530 | 13,235 | 6.2% | |
| Disorderly Conduct | 2,846 | 2,205 | 0.8% | |
| Robbery | 2,610 | 1,261 | 19.7% | |
| Sex Offense | 3,074 | 1,453 | 8.7% | |
| Contempt of Court | 4,467 | 3,306 | 0.3% | |
| Obstruction | 9,812 | 6,668 | 1.8% | |
| Trespassing | 13,228 | 10,703 | 0.2% | |
| Larceny / Theft | 41,390 | 27,529 | 3.5% | |
| Grand Larceny | 5,201 | 2,316 | 15.6% | |
| Protective Order Violation | 887 | 596 | 2.9% | |
| Drug Distribution | 1,794 | 783 | 12.8% | |
| Drug Possession | 25,716 | 11,006 | 18.8% | |
| Public Intoxication | 17,908 | 13,823 | 0.1% | |
| Driving Suspended | 21,166 | 18,136 | 18.3% | |
| Reckless Driving | 36,051 | 32,761 | 42.2% | |
| DUI / DWI | 23,651 | 17,600 | 30.3% |
Misdemeanor and felony case types only. Charges with fewer than 500 resolved cases omitted for readability. Full data at /charges.
The range is wide: from 13.9% (DUI/DWI) to 79.4% (kidnapping/abduction). The highest dismissal rates are in kidnapping/abduction (79.4%), stalking (78.4%), and assault & battery (75.9%). The lowest are in DUI/DWI (13.9%), reckless driving (23.9%), and driving suspended (30.4%). The data does not capture why these charge types cluster at opposite ends of the range.
Dismissal rate and reduction rate move inversely. Charges with low dismissal rates tend to have high reduction rates (reckless driving: 23.9% dismissed, 42.2% reduced; DUI: 13.9% dismissed, 30.3% reduced). Charges with high dismissal rates tend to have low reduction rates (assault & battery: 75.9% dismissed, 2.4% reduced). The two measures appear to capture different resolution paths within the system.
A detailed jurisdictional analysis of DUI/DWI — the charge with the lowest dismissal rate and the second-highest reduction rate — is available in the companion DWI report.
3. Felonies are dismissed at higher rates than misdemeanors
Misdemeanor
Felony
Felony cases are dismissed at a rate 17 percentage points higher than misdemeanors (59.1% vs 42.5%). The gap is driven by prosecutorial nolle prosequi: prosecutors decline to proceed on a substantially higher share of resolved felony cases than misdemeanor cases.
Of the 81,368 felony cases filed in 2025, 35,702 (43.9%) had reached a final disposition at the time of this report. The remainder include cases certified from district court to circuit court (which continue in circuit court and may not yet be resolved), revocation proceedings, and other pre-disposition statuses. All rates in this report are computed from resolved cases only.
4. In circuit court, 87.5% of convictions are guilty pleas
Virginia's case records distinguish a guilty plea from a conviction at trial only in circuit court. The General District Courts — which handle the majority of criminal and traffic matters — record a conviction simply as "guilty," without noting whether it followed a plea or a bench trial. A statewide plea rate therefore cannot be computed from this data.
Among circuit-court convictions, where the distinction is recorded, 32,526 of 37,182 (87.5%) were guilty pleas and 4,656 (12.5%) were findings of guilt at trial.
This is a limitation of the source records, not a finding about the cases: most district-court convictions are in fact uncontested, but the records do not capture the mechanism, so we report the plea-versus-trial split only where Virginia's data actually distinguishes it.
5. In circuit court, acquittal rates at trial vary dramatically by charge
Because the plea-versus-trial distinction is recorded only in circuit court (see Finding 4), trial outcomes can be measured reliably only there. Among 5,933 circuit-court trials in 2025 — findings of guilt plus acquittals — the acquittal rate varied widely by charge.
| Charge | Circuit trials | Acquittals | Acquittal rate |
|---|---|---|---|
| Sex Offense | 72 | 39 | 54.2% |
| Weapons Offense | 239 | 95 | 39.7% |
| Assault & Battery | 303 | 120 | 39.6% |
| Obstruction | 63 | 20 | 31.7% |
| Grand Larceny | 50 | 13 | 26.0% |
| Larceny / Theft | 129 | 27 | 20.9% |
| DUI / DWI | 124 | 22 | 17.7% |
| Drug Possession | 162 | 26 | 16.0% |
| Driving Suspended | 60 | 7 | 11.7% |
| Contempt of Court | 237 | 21 | 8.9% |
| Reckless Driving | 276 | 10 | 3.6% |
"Circuit trials" = acquittals + findings of guilt at trial in circuit court (excludes guilty pleas, and all district-court dispositions, which do not distinguish plea from trial). Charges with fewer than 50 circuit trials, and aggregate categories (Traffic Infraction, Failure to Appear, Other), omitted.
Person-felonies that defendants take to trial in circuit court — sex offenses, weapons charges, assault and battery — carry the highest acquittal rates, each near or above 40%. Traffic and regulatory charges that reach a circuit trial — reckless driving, driving on a suspended license — are acquitted least often, under 12%.
The data does not capture why individual trials end in acquittal. It shows only the rate at which they do, by charge type, in circuit court.
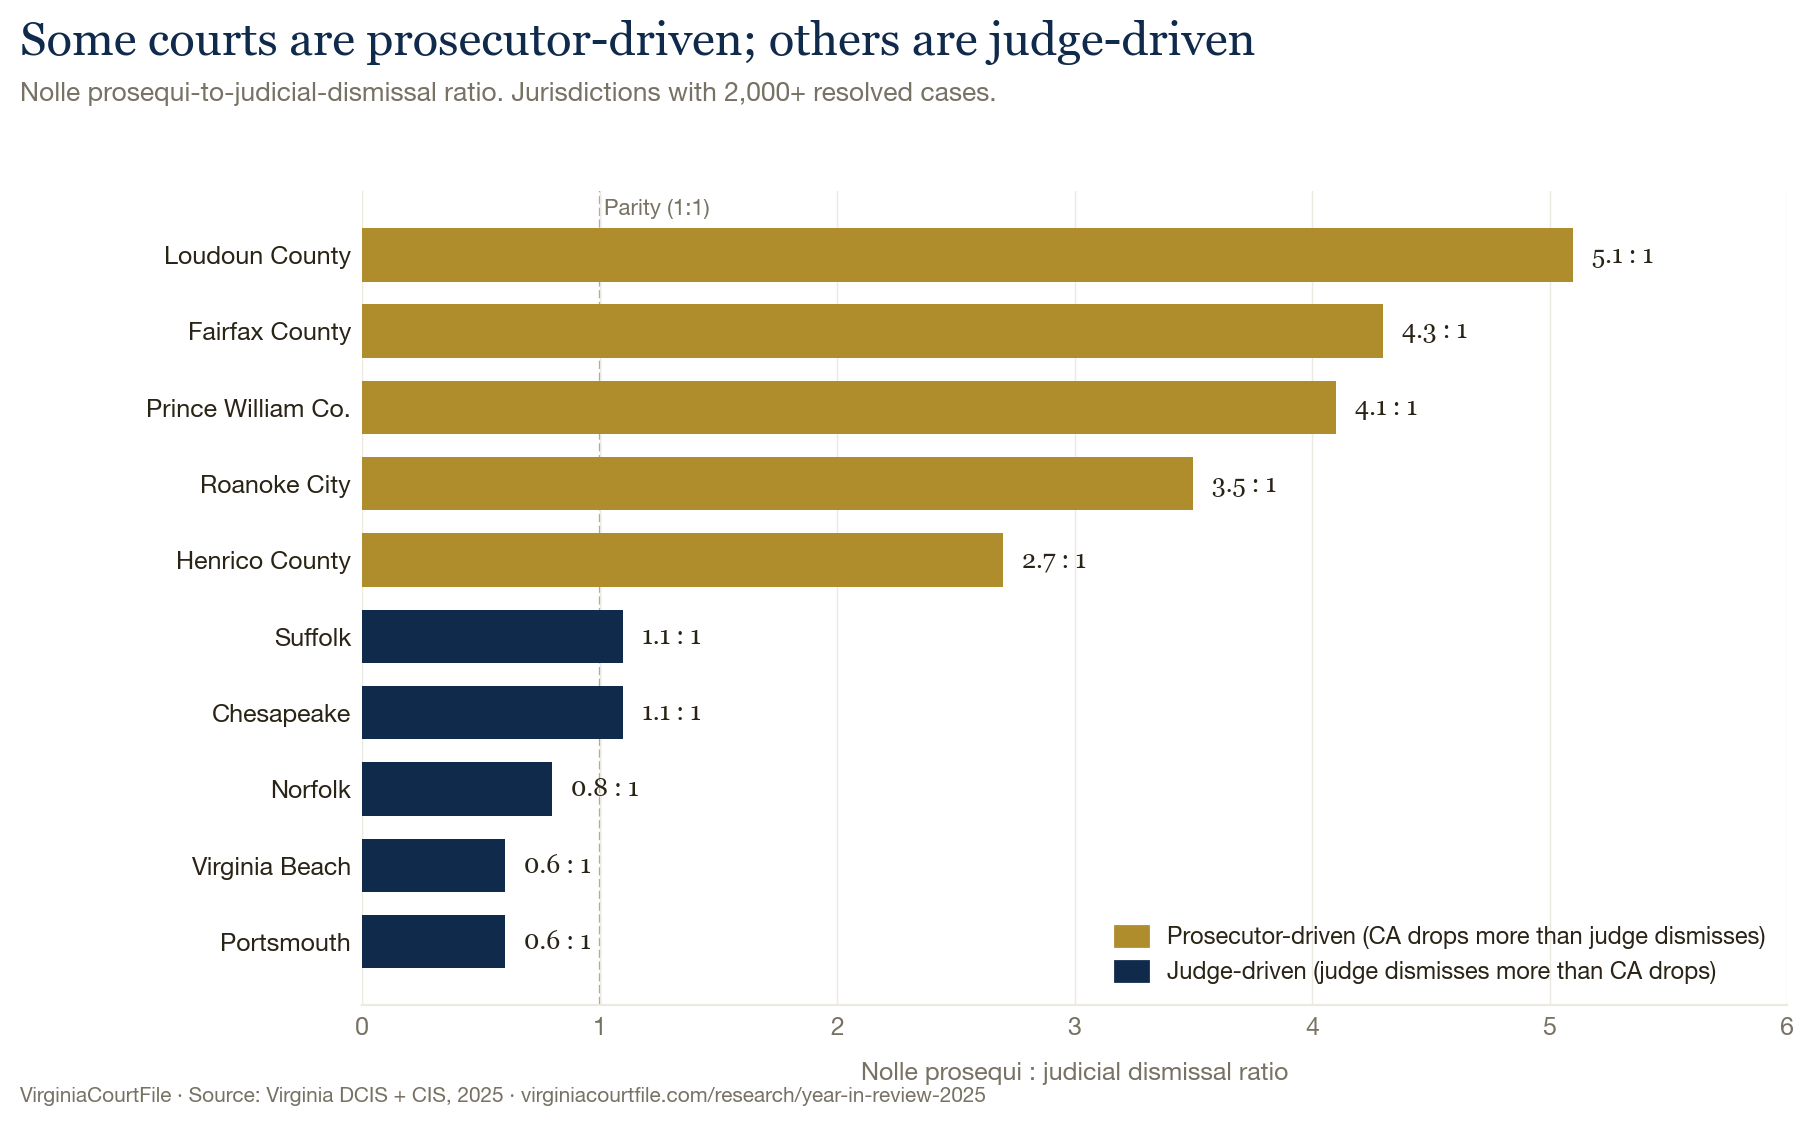
6. Some courts are prosecutor-driven; others are judge-driven
The statewide ratio of nolle prosequi to judicial dismissal is 1.9:1 — prosecutors drop more cases than judges dismiss. But this ratio varies from 0.6:1 to 5.1:1 across high-volume jurisdictions, revealing structurally different court systems operating under the same statute.
Most prosecutor-driven
Most judge-driven
Ratio = nolle prosequi count / judicial dismissal count. Jurisdictions with 2,000+ resolved criminal cases only.
In Loudoun County, for every case a judge dismisses, the Commonwealth's Attorney drops 5.1. In Portsmouth and Virginia Beach, for every case a judge dismisses, the Commonwealth's Attorney drops 0.6 — judges dismiss more than prosecutors. This is a structural difference in how these courts operate, visible only when nolle prosequi and judicial dismissal are measured separately.
7. Jurisdictional variation spans a 10:1 range
Among 81 jurisdictions with 500 or more resolved criminal cases, the overall dismissal rate ranged from 6.7% (Brunswick County) to 67.1% (Richmond City).
| Jurisdiction | Cases | Resolved | Dismissed | Nolle prosequi |
|---|---|---|---|---|
| Fairfax County | 18,660 | 14,375 | 49.7% | |
| Virginia Beach | 14,020 | 9,845 | 10.9% | |
| Prince William County | 12,439 | 8,233 | 39.9% | |
| Henrico County | 10,699 | 7,233 | 30.9% | |
| Chesterfield County | 10,370 | 6,756 | 36.6% | |
| Newport News | 9,864 | 6,366 | 33.7% | |
| Richmond City | 8,680 | 6,441 | 39.1% | |
| Norfolk | 8,452 | 6,142 | 28.1% | |
| Stafford County | 6,656 | 4,198 | 27.6% | |
| Chesapeake | 6,617 | 3,370 | 29.6% |
Fairfax County, the highest-volume jurisdiction (18,660 criminal cases), has a 62.4% dismissal rate. Virginia Beach, the second-highest-volume jurisdiction (14,020 cases), has a 30.8% rate. Both are large suburban jurisdictions. The data does not explain the difference.
The 10:1 ratio between the highest and lowest jurisdiction dismissal rates (67.1% vs 6.7%) exceeds the variation observed within any single charge type. Full jurisdiction-level data is available at /courts.
8. Demographics of the charged population
Gender and race data are recorded for nearly all cases in this dataset. This finding describes who enters Virginia's criminal court system as recorded in public case data. It does not describe who commits crimes. Court records reflect enforcement decisions, charging decisions, and systemic factors not captured in disposition data.
Gender
Male
Female
Male defendants account for 74.0% of criminal cases. Female defendants account for 25.8%. The remaining 0.2% are recorded as "Other (Includes Not Applicable, Unknown)" or unrecorded.
Race
With that limitation stated, the race field as recorded:
| Race (as recorded) | Cases | % of cases |
|---|---|---|
| White | 148,448 | 53.2% |
| Black | 119,059 | 42.7% |
| Asian / Pacific Islander | 3,042 | 1.1% |
| American Indian / Alaska Native | 267 | 0.1% |
| Hispanic or Latino | 10 | 0.0% |
| Unknown / Other / Unrecorded | 8,124 | 2.9% |
"Black" combines entries recorded as "Black" and "Black Or African American." Race as recorded in the court system; does not reliably capture ethnicity.
Outcome rates by race. Among resolved cases where race is recorded as White or Black:
| Race | Resolved | Dismissal rate | Nolle rate | Acquittal rate |
|---|---|---|---|---|
| White | 101,092 | 42.4% | 26.6% | 2.1% |
| Black | 81,105 | 51.3% | 32.1% | 2.8% |
The dismissal rate for cases recorded as Black (51.3%) is 8.9 percentage points higher than for cases recorded as White (42.4%). This does not mean the system treats Black defendants more favorably — the two groups are charged with different offenses at different rates, and those offenses have different baseline dismissal rates. Among the recorded racial categories, Black defendants face weapons offenses (a charge with a 66.9% statewide dismissal rate) at a substantially higher share than White defendants; White defendants face DUI/DWI (a charge with a 13.9% dismissal rate, the lowest in the dataset) at a substantially higher share. The charge mix difference alone could produce a higher aggregate dismissal rate for Black defendants regardless of any other factor. This data does not isolate the effect of charge mix from other variables.
This report presents the demographic data as recorded. It does not compute overrepresentation ratios because the ethnicity recording gap makes such comparisons unreliable. Researchers working with this data should account for the Hispanic/Latino classification issue before drawing population-level conclusions.
Scope, methodology, and limitations
Coverage. 278,950 criminal cases classified as misdemeanor or felony in Virginia's public court records, filed January 1 – December 31, 2025. Twenty-six named charge categories across 125 jurisdictions in both district and circuit courts.
Excluded. Traffic infractions (728,229 cases); the "Other" charge category (641,750 cases of all types); failure-to-appear warrants (32,838 cases). Including these would inflate the case count without adding interpretive clarity to the criminal-charge analysis.
A note on the "Other" exclusion. The "Other" charge category aggregates charges our taxonomy does not yet classify into named categories — including substantively criminal entries such as assault on law enforcement, malicious wounding, and drug manufacturing/distribution variants. Future editions will expand the charge taxonomy to capture more of these.
Definitions. Resolved = case reached a final disposition (dismissed, nolle prosequi, acquitted, guilty plea, or found guilty). Dismissed = nolle prosequi + judicial dismissal + acquittal, reported separately throughout. Reduced = original charge amended to a lesser offense at disposition. Plea rate = guilty pleas as a percentage of convictions, computed for circuit court only — district-court records do not distinguish a guilty plea from a bench-trial conviction. Trial = acquittal + finding of guilt (excludes pleas), likewise circuit court only.
Unit of analysis. Each row in the dataset is a charge, not a case. In this dataset, the overwhelming majority of case numbers appear only once. Multi-charge cases do not materially affect per-charge rates.
Demographic data. Race and gender are analyzed in Finding 8. Race is recorded for nearly all cases, but the ethnicity field is unreliable — only 10 cases are recorded as Hispanic/Latino in a state with ~10% Hispanic population (see Finding 8 for details). Gender is recorded for all cases. Researchers interested in further equity analysis can explore the underlying data at /charges and /courts, or contact us for methodological discussion.
What this data does not capture. Plea negotiation dynamics, evidence quality, witness cooperation, judicial reasoning, the specific facts of individual cases, whether defendants were represented by counsel, income, or prior criminal history. The data shows what happened; it does not show why.
Baseline year. This is the first year of this dataset. Year-over-year comparison will be possible when 2026 data collection is complete.
Full methodology at /methodology.
Cite as: VirginiaCourtFile.com, "Virginia Criminal Court Outcomes, 2025," May 2026 (rev. May 14, 2026). Available at virginiacourtfile.com/research/year-in-review-2025.
Related: Virginia DWI Court Outcomes: A 2025 Jurisdictional Analysis
Data last updated: May 2, 2026 · VirginiaCourtFile.com · Contact