Research Report · 2025 Data · Methodology · Verified 2026-05-29
Virginia DWI Court Outcomes
A jurisdictional analysis of 23,651 cases filed in 2025
The same DUI charge under Va. Code §18.2-266 carries the same maximum penalties everywhere in Virginia. The court outcomes are not the same. Among jurisdictions with 50+ resolved cases, combined dismissal rates (judicial + nolle prosequi) in 2025 ranged from 1.5% to 28.2%.
This analysis covers 23,651 DUI/DWI cases filed across Virginia jurisdictions during calendar year 2025. The data is drawn from public Virginia court records and includes both district court proceedings (where most DUI cases begin) and circuit court proceedings (felony DUI, appeals, and certified cases).
Refreshed 2026-05-15 against the source case-level dataset; every statistic re-derivable from public court records per the published methodology.
Nine findings emerged from the data. Each is discussed in detail below.
1. Jurisdictional variation in dismissal rates is wide and persistent
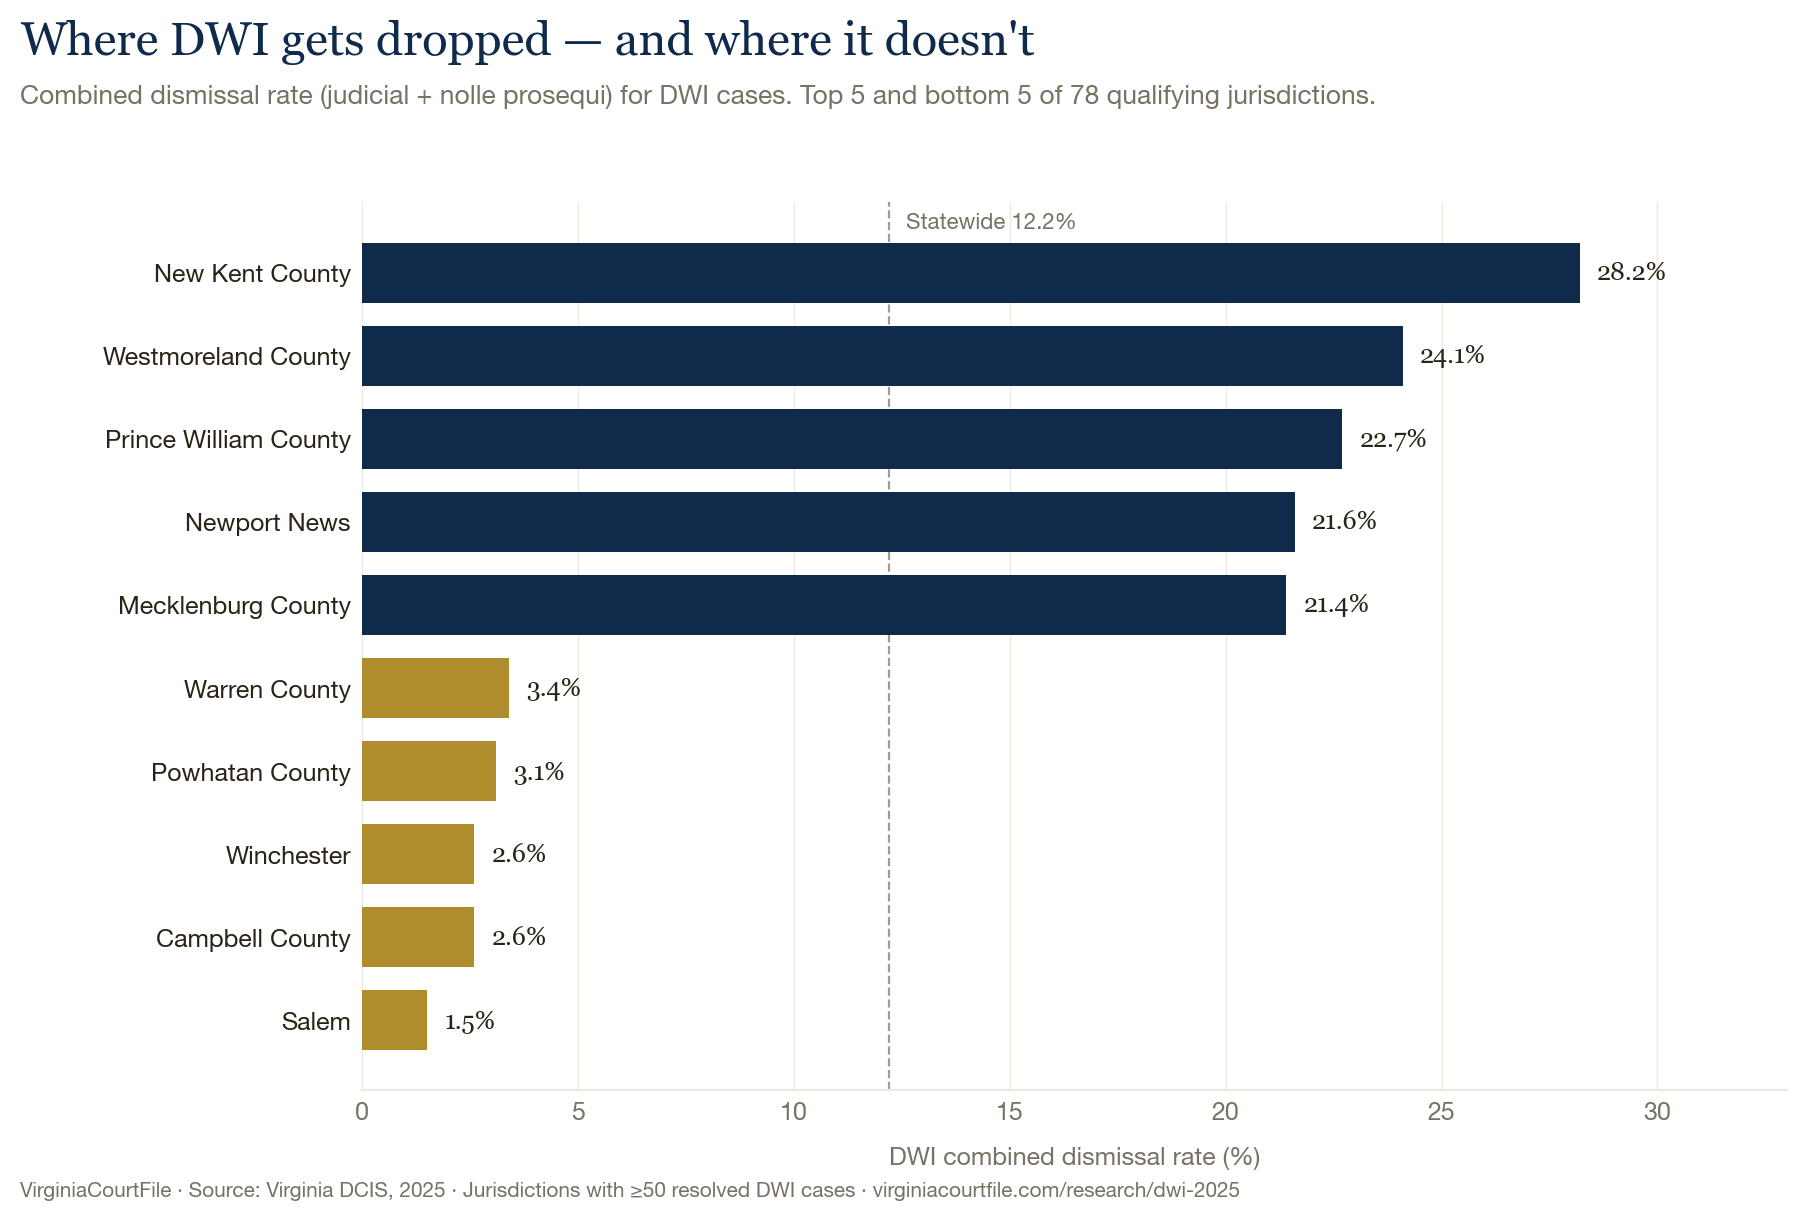
The statewide combined dismissal rate for DUI/DWI cases (judicial dismissal plus nolle prosequi) was 12.2%. That average conceals wide variation across individual jurisdictions.
Whether this variation reflects differences in prosecutorial policy, judicial practice, local defense bar activity, case demographics, or some combination is not determinable from disposition data alone. What is determinable: the variation is large and not explained by the charge itself, which is uniform statewide under the same statute.
| Jurisdiction | DUI cases | Dismissed | Reduced |
|---|---|---|---|
| New Kent County | 227 | 28.2% | 20.0% |
| Westmoreland County | 115 | 24.1% | 44.1% |
| Prince William County | 1,140 | 22.7% | 47.6% |
| Newport News | 707 | 21.6% | 35.3% |
| Mecklenburg County | 142 | 21.4% | 38.6% |
| ... | |||
| Warren County | 206 | 3.4% | 18.8% |
| Powhatan County | 83 | 3.1% | 22.2% |
| Campbell County | 106 | 2.6% | 16.7% |
| Winchester | 100 | 2.6% | 24.0% |
| Salem | 81 | 1.5% | 26.2% |
Jurisdictions with fewer than 50 resolved DUI/DWI cases excluded. Full 78-jurisdiction dataset at the DUI/DWI charge page.
Notice that dismissal rate and reduction rate don't always move together. Salem dismisses just 1.5% of DUI cases but reduces 26.2%. Powhatan County dismisses 3.1% but reduces 22.2%. Different courts resolve cases through different mechanisms, and a defendant whose court rarely dismisses outright may still see a notable rate of negotiated charge reductions.
2. Prosecutors, not judges, drive most DUI dismissals
The 12.2% statewide combined dismissal rate is composed of two distinct mechanisms with different implications for defense strategy:
Nolle prosequi
Judicial dismissal
Across all jurisdictions, nolle prosequi accounts for the majority of DUI dismissals. The data does not capture the reasons behind individual nolle prosequi decisions, but the pattern is clear: in aggregate, prosecutors drop nearly four times as many DUI cases as judges dismiss outright (1,693 nolle vs. 447 judicial dismissals on 17,600 resolved cases statewide).
That ratio varies significantly by court:
| Jurisdiction | Resolved (district) | Nolle prosequi | Judicial dismissal |
|---|---|---|---|
| Fairfax County | 1,601 | 13.7% | 1.7% |
| Virginia Beach | 959 | 4.2% | 0.6% |
| Chesterfield County | 794 | 9.1% | 1.4% |
| Prince William County | 766 | 20.2% | 2.1% |
| Henrico County | 599 | 7.0% | 7.2% |
| Loudoun County | 553 | 10.3% | 2.5% |
| Newport News | 461 | 17.8% | 3.7% |
| Arlington County | 396 | 8.8% | 2.5% |
| Stafford County | 369 | 10.3% | 1.6% |
| Chesapeake | 310 | 7.4% | 4.8% |
Fairfax County is overwhelmingly prosecutor-driven: an 8:1 ratio of nolle to judicial dismissal. Virginia Beach (7:1 in the opposite proportional direction) shows the lowest district-court drop rates overall. Prince William County has the highest combined drop rate among high-volume courts — with both prosecutor and judicial dismissal contributing.
3. District court and circuit court are structurally different proceedings
Virginia DUI cases appear in both court systems. District courts handle first-offense misdemeanor DUI (the vast majority). Circuit courts handle felony DUI (third or subsequent offenses), appeals from district court, and cases certified up from preliminary hearings.
District court
Circuit court
The combined dismissal rates are essentially identical (12.1% district vs 12.3% circuit), but the reduction rate diverges sharply. District court cases are reduced roughly twice as often as circuit court cases (30.8% vs 15.1%). The difference in case composition — more serious charges (felony DUI, repeat offenders) reaching circuit court — is the most likely driver of the reduction rate gap, though the data does not directly test this.
Combining these two court types into a single rate would obscure the distinct dynamics at work. A first-offense defendant in district court faces a structurally different proceeding than a third-offense defendant in circuit court, even if both are charged under the same statute.
4. Nearly three in ten convicted DUI defendants had their charge reduced
Among DUI cases that ended in conviction, 29.1% were resolved through a charge reduction — the original DUI amended to a lesser offense through negotiation between defense counsel and the Commonwealth's Attorney.
The two most common reduction targets:
- Reckless driving (general): 1,863 reductions — Va. Code §46.2-852, a Class 1 misdemeanor but without the mandatory license suspension and ignition interlock that attach to a DUI conviction
- DWI 1st (lesser DWI specification): 1,305 reductions
The reduction rate is not evenly distributed:
Highest reduction rates
Lowest reduction rates
Among jurisdictions with 50+ DUI convictions in 2025. Reduction rate = share of convictions on a lesser amended charge.
In Fairfax County, more than four out of five convicted DUI defendants were convicted on a reduced charge. In Charlottesville, fewer than one in fifty. Same statute, same state.
5. DUI outcomes follow regional patterns
The jurisdictional variation is not random. It clusters geographically:
Northern Virginia has the highest reduction rate by a wide margin and the highest dismissal rate. Hampton Roads has the lowest reduction rate. Southwest Virginia has the lowest dismissal rate. Richmond Metro sits in the middle on both measures. The causes of these regional patterns are not determinable from disposition data, but the patterns themselves are consistent across the jurisdictions within each region.
6. The counsel comparison requires careful reading
The measured outcomes by counsel type are counterintuitive at first glance:
| Representation | Cases | Dismissed | Reduced |
|---|---|---|---|
| Private attorney | 18,063 | 10.9% | 30.0% |
| Public defender | 4,197 | 14.2% | 27.1% |
| No attorney listed | 1,391 | 30.0% | 15.7% |
The no-attorney dismissal rate is the highest. That does not mean self-represented defendants fare better. Two measurable differences in the no-attorney case population explain most of the gap:
- Court type and severity: Almost all no-attorney DUI cases are first-offense misdemeanors in district court. Almost no unrepresented defendants appear in circuit court, where cases are more serious and more contested.
- Dismissal mechanism: No-attorney cases are dropped at notably higher rates by both prosecutors (nolle prosequi) and judges. The elevated rate on both sides suggests these cases differ systematically from represented cases in ways the disposition data does not capture — possibly weak evidence, charging error, or non-appearance dynamics.
The reduction rate is the more direct comparison and better isolates negotiation outcomes from selection effects. Private attorneys' cases resulted in charge reductions 30.0% of the time, nearly twice the unrepresented rate of 15.7%. Public defenders fall in between at 27.1%.
7. In circuit court, few DUI cases go to trial
Virginia's case records distinguish a guilty plea from a trial conviction only in circuit court; the General District Courts, where most DUI cases resolve, record a conviction simply as "guilty," so a statewide DUI plea rate cannot be computed. Among 1,665 circuit-court DUI convictions in 2025, 1,563 (93.9%) were guilty pleas and 102 (6.1%) were findings of guilt at trial.
Because plea-versus-trial is recorded only in circuit court, the charge reduction rate (29.1% of convictions for DUI) is the primary measurable dimension of case negotiation across all courts in the disposition data.
A jurisdiction with a 5% dismissal rate and a 40% reduction rate produces different outcomes than one with a 5% dismissal rate and a 5% reduction rate. The reduction rate captures variation that the dismissal rate alone does not.
8. Second-offense defendants are reduced at higher rates than first-offense
Charge text in the court records allows a partial classification of offense level. Among cases where offense level could be determined:
| Offense level | Cases | Resolved | Dismissed | Reduced |
|---|---|---|---|---|
| 1st offense | 18,978 | 14,574 | 12.2% | 26.4% |
| 2nd offense | 3,040 | 2,288 | 10.9% | 42.9% |
| 3rd+ offense | 1,520 | 694 | 13.7% | 39.6% |
Offense level derived from charge description text (e.g., "DWI, 1ST", "DWI, 2ND"). 113 cases with non-standard charge descriptions could not be classified and are excluded. Dismissal column reports combined judicial dismissal + nolle prosequi.
The higher reduction rate for second offenses (42.9% vs. 26.4% for first offenses) is counterintuitive. Under Va. Code §18.2-270, a second DUI conviction within five or ten years carries mandatory minimum jail time (20 days within five years; 10 days within ten years), mandatory license revocation, and mandatory ignition interlock. The disposition data does not reveal why higher-severity cases are reduced more often, but the statutory consequences that attach to a second-offense conviction are substantially more severe than those for a first offense.
Dismissal rates are similar across offense levels (10.9%–13.7%). The decision to drop a case does not appear to correlate strongly with offense level in this data.
9. Case duration varies by jurisdiction and by outcome
The statewide median time from filing to disposition for resolved DUI cases was 110 days (P25: 71 days, P75: 167 days). That median conceals variation across both jurisdictions and outcome types.
Duration analysis is restricted to cases with valid disposition dates on or before the data cutoff. 17,599 of 17,600 resolved DUI cases had valid duration data.
Per-outcome and per-jurisdiction time-to-disposition breakdowns for DUI cases are available on the DUI/DWI charge page and individual court pages. The ordering — cases ending in conviction on the original charge resolve fastest, cases resolved through reduction fall in the middle, and dismissed/dropped cases take the longest — is consistent across jurisdictions and reflects the additional motion practice and continuances that precede a non-conviction outcome.
Limitations and next steps
This analysis establishes baseline rates for a single calendar year. Several questions it does not answer — and that future analyses should:
- Year-over-year trend. 2025 is the first year of this dataset. Whether the jurisdictional patterns described here are stable, widening, or narrowing requires at minimum a second year of comparison data. That analysis will follow when the 2026 data is complete.
- Causal mechanisms. Court disposition data captures what happened, not why. The prosecutorial vs. judicial dismissal split is the closest this data comes to mechanism, but it does not capture the reasoning behind any individual nolle prosequi or the plea dynamics that produced a particular reduction.
- Case severity. Not all DUI charges are equivalent. BAC level, accident involvement, prior record, and refusal status all affect outcomes but are not captured in the disposition data. The district-circuit split is a partial proxy for severity, but a coarse one.
- Counsel selection bias. The counsel comparison is observational. Defendants who retain private counsel, qualify for public defenders, and proceed without representation differ systematically in ways that confound outcome comparisons. The reduction rate gap is the most defensible comparison; the dismissal rate gap is the least.
Jurisdiction-level data for individual courts is available at virginiacourtfile.com/charges/dui-dwi. Officer-level case statistics are available at virginiacourtfile.com/officers.
Cite as: VirginiaCourtFile.com, "Virginia DWI Court Outcomes: A 2025 Jurisdictional Analysis," May 2026 (rev. May 15, 2026). Available at virginiacourtfile.com/research/dwi-2025.
Related: Virginia Criminal Court Outcomes, 2025 — statewide analysis of 278,950 criminal cases across all charge types
Data last updated: May 2, 2026 · VirginiaCourtFile.com · Contact