Office-Level Accountability Report · Published May 10, 2026 · Methodology · Verified 2026-05-29
Virginia Prosecutorial Accountability — 2025 Report
166,576 charges across 119 Commonwealth's Attorney offices · 30 of 31 judicial circuits
This report presents office-level accountability data for Virginia's 119 Commonwealth's Attorney offices, covering 166,576 charges filed in calendar year 2025 across 30 of Virginia's 31 judicial circuits. Among the 59 jurisdictions with at least 1,000 filings, direct-indictment rates vary 20-fold. Trial rates on contested cases range from under 1% to over 50%. Probation-revocation outcomes (separate from new-offense convictions) are a major share of circuit court activity in some jurisdictions and a minor share in others. The report frames data at the office level and does not attribute outcomes to individual prosecutors.
Published by VirginiaCourtFile.com from public Virginia Circuit Court records. All statistics independently verifiable against the source data. The 19th Judicial Circuit (Fairfax County, Fairfax City, Falls Church) is excluded — that circuit operates outside Virginia's statewide Case Information System.
In this report
- Direct-indictment rates vary 20-fold across Virginia jurisdictions
- Trial rates on contested cases range from under 1% to over 50%
- Probation revocations are a major share of circuit court activity, varying widely
- Nolle prosequi rates concentrate in two patterns: routine (10–15%) and elevated (28–39%)
- Guilty rates cluster around the median; the spread is narrower than direct-indictment patterns
- District-court appeal volume is jurisdictionally distinctive
- Charge amendment data is too sparse for office-level rate analysis
- Disposition coverage varies almost 2× across jurisdictions, requiring per-page disclosure
- Methodology issues this report surfaces
- Findings deliberately held from publication
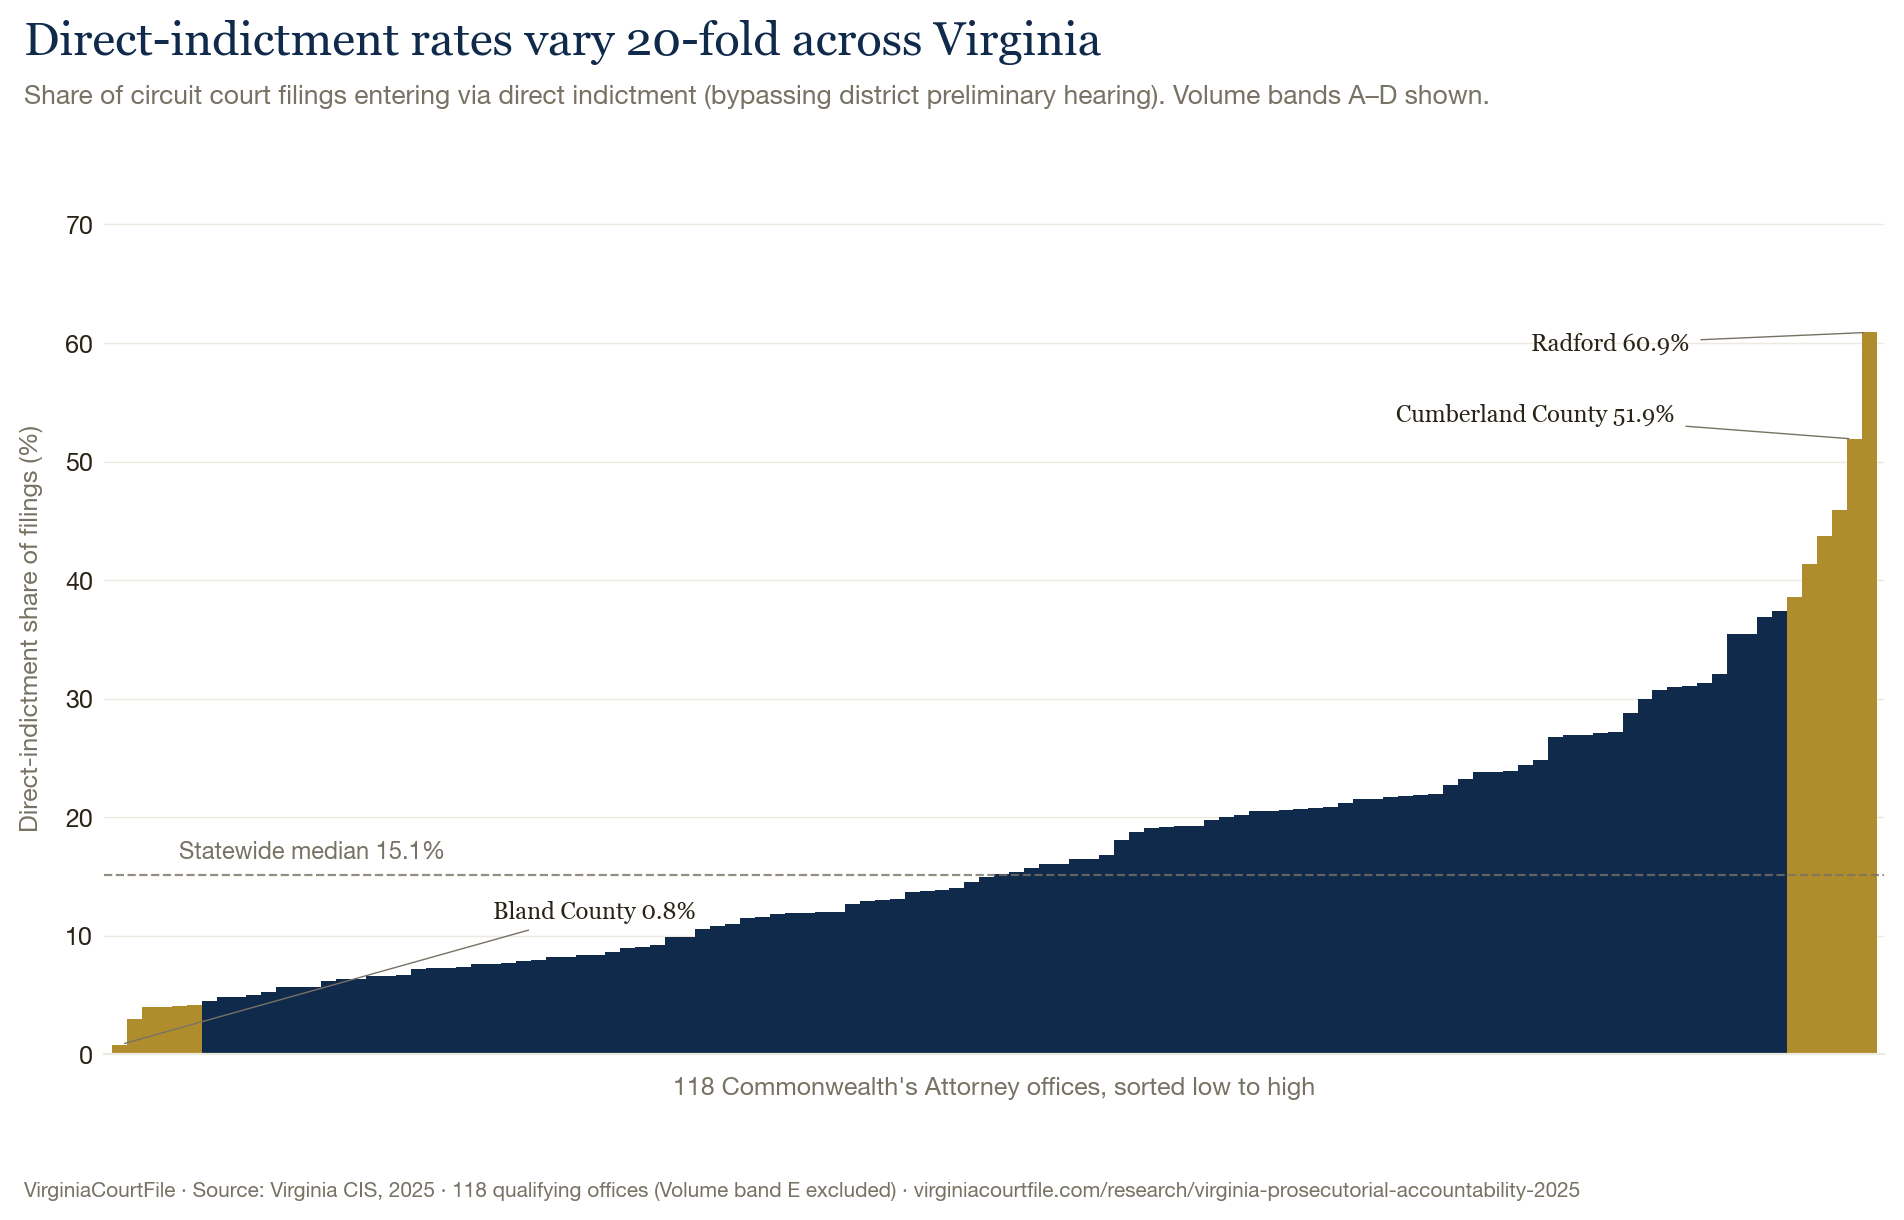
1. Direct-indictment rates vary 20-fold across Virginia jurisdictions
The Commonwealth's Attorney's office can initiate a felony charge in Circuit Court by direct indictment — taking the case to a grand jury without a preliminary hearing in District Court. The choice of method is at the office's discretion. Across 119 Virginia jurisdictions, the rate at which offices use direct indictment varies dramatically.
| Statewide benchmark | Value |
|---|---|
| Median direct-indictment rate (118 offices, ≥50 filings) | 15.1% |
| 25th percentile (lower quartile) | 8.2% |
| 75th percentile (upper quartile) | 21.9% |
| Median direct-indictment rate (59 offices, ≥1,000 filings) | 13.1% |
| Lowest (Volume A, ≥1,000 filings) | 3.0% (Bristol) |
| Highest (Volume A, ≥1,000 filings) | 60.9% (Radford) |
Sample of the variation across ten Volume A jurisdictions (each with at least 1,000 filings in 2025):
| Jurisdiction | Total filings | Direct indict % | vs median (13.1%) |
|---|---|---|---|
| Suffolk | 3,643 | 36.9% | +23.8 pts |
| Richmond City | 3,963 | 31.1% | +18.0 pts |
| Wise | 1,759 | 30.7% | +17.6 pts |
| Tazewell | 3,013 | 24.4% | +11.3 pts |
| Henrico | 6,558 | 14.5% | +1.4 pts |
| Chesterfield | 4,429 | 13.9% | +0.8 pts |
| Loudoun | 2,008 | 12.0% | −1.1 pts |
| Norfolk | 4,685 | 11.6% | −1.5 pts |
| Virginia Beach | 7,065 | 8.2% | −4.9 pts |
| Newport News | 4,307 | 4.5% | −8.6 pts |
Two metrics for the median appear above. The 13.1% median applies among the 59 Volume A jurisdictions (≥1,000 filings) and is the reference for the comparison column. The 15.1% median applies across the broader 118-jurisdiction set with at least 50 filings.
The pattern itself is the finding. Some Virginia offices route a large share of cases through direct indictment; others rely primarily on grand jury indictment after district-court preliminary hearings. This report does not assess whether one pattern is preferable to another — that is a question of prosecutorial philosophy, charge mix, and local case management practices, none of which are observable from court filing data alone.
2. Trial rates on contested cases range from under 1% to over 50%
"Trial rate" can mean different things depending on the denominator. Two definitions are useful:
- Trial rate against all resolved cases: denominator includes nolle prosequi, probation revocations, and other procedural outcomes; tends to be small (1–5% statewide) because most circuit court activity is not contested adjudication.
- Trial rate against contested cases: denominator includes only guilty pleas, trial verdicts, dismissals, withdrawals, and transfers — capturing the share of cases that reached a contested determination rather than the office's choice to drop or revoke.
This report uses the second definition for the variance analysis below. The denominator excludes nolle prosequi (the office's decision to drop a case before trial) and probation revocations (proceedings on prior convictions, not new contested charges).
| Jurisdiction | Contested resolved | Trials | Trial rate | Plea rate |
|---|---|---|---|---|
| Newport News | 1,230 | 243 | 19.8% | 42.8% |
| Norfolk | 1,379 | 212 | 15.4% | 70.3% |
| Henrico | 2,702 | 410 | 15.2% | 69.5% |
| Virginia Beach | 3,573 | 470 | 13.2% | 76.6% |
| Chesterfield | 1,298 | 162 | 12.5% | 69.0% |
| Loudoun | 499 | 34 | 6.8% | 61.5% |
| Richmond City | 965 | 65 | 6.7% | 75.3% |
| Suffolk | 1,161 | 58 | 5.0% | 70.8% |
| Wise | 389 | 15 | 3.9% | 81.2% |
| Tazewell | 395 | 3 | 0.8% | 58.2% |
Statewide median trial rate on contested cases (118 offices, ≥50 filings): 9.5%. Among the 59 Volume A jurisdictions, the range runs from 0.0% (Bristol — zero trials among 654 contested resolutions) and 0.8% (Tazewell — three trials among 395 contested) at the low end, to over 50% in several smaller-metro and rural-VA jurisdictions including Pittsylvania (58.5%), Lynchburg City (56.0%), Martinsville (54.0%), and Botetourt (52.0%).
3. Probation revocations are a major share of circuit court activity, varying widely
Many Circuit Court filings are not new offense charges but probation violation reviews under Va. Code § 19.2-306. The Commonwealth's Attorney files these proceedings on prior convictions where the office alleges probation has been violated. Resolutions appear in the data with disposition code "Sentence/Probation Revoked" — separate from "Guilty," "Nolle Prosequi," or "Dismissed."
Statewide in 2025, "Sentence/Probation Revoked" appeared as a disposition 31,449 times — 26.6% of all resolved circuit court activity (118,447 resolved cases statewide). The share varies dramatically across jurisdictions:
| Jurisdiction | Probation revoked / resolved | Guilty / resolved |
|---|---|---|
| Tazewell | 39.0% | 19.1% |
| Wise | 35.4% | 31.4% |
| Charlottesville | 26.3% | 37.0% |
| Norfolk | 21.3% | 34.0% |
| Loudoun | 20.8% | 27.1% |
| Northampton | 17.8% | 44.9% |
| Virginia Beach | 16.7% | 59.7% |
| Richmond City | 14.9% | 32.9% |
| Suffolk | 14.0% | 34.6% |
| Newport News | 7.2% | 23.4% |
For some Virginia jurisdictions (Tazewell, Wise), probation revocation activity exceeds new-offense conviction activity. For others (Newport News, Virginia Beach), probation revocations are a much smaller share of total resolutions. The pattern is the finding; the underlying drivers (active supervision caseloads, parole-revocation referral practices, charge mix at original conviction) are not observable from this dataset.
This is why "conviction rate" as a single number is misleading without context — a jurisdiction with high probation activity has many "Guilty" outcomes that reflect revocation findings rather than fresh contested adjudication.
4. Nolle prosequi rates concentrate in two patterns: routine (10–15%) and elevated (28–39%)
Nolle prosequi — the Commonwealth's Attorney's decision to decline further prosecution after a charge has been filed — represents a defined fraction of resolved circuit court cases.
| Statewide benchmark | Value |
|---|---|
| Median nolle prosequi rate (118 offices) | 17.8% |
| Total nolle prosequi outcomes statewide, 2025 | 20,962 |
Among the 10 stress-test Volume A jurisdictions, the nolle rate falls into roughly two clusters:
| Cluster | Range | Example jurisdictions |
|---|---|---|
| Routine | 10–18% | Loudoun (10.9%), Charlottesville (13.0%), Northampton (14.4%), Newport News (17.4%) |
| Mid-range | 20–25% | Norfolk (22.4%), Wise (24.6%) |
| Elevated | 28–39% | Richmond City (28.9%), Tazewell (33.2%), Suffolk (38.8%) |
An elevated nolle prosequi rate can mean different things. It can reflect cases initiated quickly (e.g., direct indictment) that the office subsequently determines not to pursue. It can reflect plea-bargaining patterns where original charges are dropped in exchange for guilty pleas to amended charges. It can reflect changed evidence quality. The data does not distinguish among these possibilities.
Suffolk and Richmond City both rank in the top tier of Volume A jurisdictions on direct-indictment rate (36.9% and 31.1% respectively, vs the Volume A median of 13.1%) and also rank in the top tier on nolle prosequi rate (38.8% and 28.9%, vs the statewide median of 17.8%). The two patterns may be related, but the data does not establish a causal link.
5. Guilty rates cluster around the median; the spread is narrower than direct-indictment patterns
Guilty disposition rates (cases resolved with disposition "Guilty" / all resolved cases) cluster more tightly than the filing-pattern variations described above.
| Statewide benchmark | Value |
|---|---|
| Median guilty rate (118 offices, ≥50 filings) | 34.9% |
| 25th percentile | 29.8% |
| 75th percentile | 40.6% |
The middle 50% of Virginia jurisdictions have guilty rates between 29.8% and 40.6% — a narrower band than direct-indictment rates (which span 8.2%–21.9% for the same percentile range, but with much larger absolute outliers). Convictions, in absolute terms, are a more uniform feature of Virginia circuit court activity than charging patterns.
This is consistent with the broader observation that prosecutorial discretion shows up most visibly at the front end of the case (whether and how to charge) rather than at the back end (whether a charged case is convicted). The mechanisms that drive low-conviction outcomes — declination, dismissal, plea negotiation — are largely invisible to court filing data.
6. District-court appeal volume is jurisdictionally distinctive
Some circuit court filings arrive on appeal from a District Court. Across the state, "General District Court Appeal" was the filing type for 19,908 charges in 2025 (12.0% statewide). Per-jurisdiction shares vary substantially:
| Jurisdiction | Total filings | DGC appeal % |
|---|---|---|
| Northampton | 620 | 42.1% |
| Newport News | 4,307 | 31.9% |
| Loudoun | 2,008 | 22.4% |
| Norfolk | 4,685 | 19.2% |
| Virginia Beach | 7,065 | 18.1% |
| Richmond City | 3,963 | 13.9% |
| Suffolk | 3,643 | 7.5% |
| Charlottesville | 468 | 5.6% |
| Wise | 1,759 | 3.1% |
| Tazewell | 3,013 | 0.6% |
For some jurisdictions, district-court appeals are a major share of circuit court business; for others, virtually none. This pattern reflects the jurisdiction's case-mix at the lower court (charges that draw appeals) and the office's own appellate posture, neither of which are individually observable from filing data.
7. Charge amendment data is too sparse for office-level rate analysis
The dataset includes an "Amended Charge" field that captures formally-recorded modifications of the original charge. Across all Virginia 2025 circuit court filings, this field is populated on 4.33% of records (7,205 of 166,576). Per-jurisdiction density varies from under 1% to over 16%.
Most charge amendments in Virginia practice happen informally at sentencing or as part of plea negotiation; only formally-amended charges enter the field. This makes amendment data unsuitable as a primary office-level metric.
Per-jurisdiction CA office pages display amendment data only for jurisdictions with 1,000+ filings (Volume A), where sample sizes support meaningful comparison. Smaller jurisdictions display amendment data only as raw counts, with explicit disclosure that the field captures only formal amendments.
8. Disposition coverage varies almost 2× across jurisdictions, requiring per-page disclosure
Disposition codes (the field recording how a case resolved) are populated on 71.1% of 2025 filings statewide. But coverage varies substantially by jurisdiction:
| Jurisdiction example | Disposition coverage |
|---|---|
| Amelia (high coverage) | 92.2% |
| King William | 88.5% |
| Northampton | 86.3% |
| Statewide median (selected) | ~71% |
| Buchanan | 53.2% |
| Buckingham | 48.3% |
| Radford (lowest) | 47.7% |
Lower-coverage jurisdictions reflect either slower case-completion timing (cases still pending) or slower data entry into the Case Information System. Per-jurisdiction CA office pages display the completion rate as a methodology disclosure on every page, so readers can interpret rate-based metrics with appropriate caution.
For Q1 2026 specifically, disposition coverage is only 34.3% (vs 71.1% for full-year 2025). Q1 2026 disposition rates are therefore not displayed on per-jurisdiction pages; the methodology requires year-2025 data for rate-based comparisons.
Methodology issues this report surfaces
Three structural issues confound naïve interpretations of Virginia prosecutorial accountability data. We document them here because any researcher using this data will face them.
The pre-filing decision is invisible
The dataset records charges filed in Circuit Court. Cases that the Commonwealth's Attorney's office declined to file — either because evidence was insufficient, the matter was diverted, or the case was resolved at the District Court level — are not in this dataset. A jurisdiction that files everything and then nolles 50% of cases looks substantively different from one that declines 50% before filing, even if their underlying behavior is similar. This dataset cannot distinguish between those two scenarios.
The plea-bargain trail is mostly invisible
Most plea negotiations in Virginia practice involve informal charge reduction at sentencing, often without formal entry into the Amended Charge field. This means the formally-recorded amendment rate (4.33%) understates the true frequency of charge negotiation. Office-level comparisons of formal amendment rates therefore reflect both negotiation practice and recording practice — they cannot be cleanly attributed to either.
Sentencing data reflects mandatory minimums and charge mix
Sentencing fields (SentenceTime, SentenceSuspended) are populated on 32–37% of records (conviction-only). Comparing sentence lengths across jurisdictions is meaningful only when paired with charge-mix context — a jurisdiction with more violent felonies will appear "harsher" than one with more low-level offenses, even if the offices apply identical principles. Per-jurisdiction CA office pages display sentencing data only on Volume A jurisdictions and only paired with the top-charges section, so context travels with the metric.
Findings deliberately held from publication
Six patterns visible in the data are not published as findings here, either pending external verification or because the underlying data quality does not support a publishable claim.
- Causal claims about why office patterns differ. Direct-indictment rates of 8.2% vs 36.9% reflect office-level decision-making, but the data does not show why offices choose differently. Held until paired with qualitative interviews or office-level policy disclosures.
- Individual prosecutor attribution. Multiple assistant Commonwealth's Attorneys work within each office. The data does not record which prosecutor handled which case. Office-level patterns are presented; individual-level claims are not made.
- Q1 2026 disposition rates. Only 34.3% of Q1 2026 cases have reached resolution. Year-over-year disposition rate comparisons are not yet meaningful for Q1 2026 alone.
- Race / demographic breakdowns of prosecuted cases. Hispanic-ethnicity recording in the dataset is severely under-represented (per the Q1 2026 Circuit Court report, only 2 Hispanic-coded defendants in Q1 2025; 26 in Q1 2026 — both implausibly low). Demographic-disparity analysis from this data alone would be unreliable.
- Charge declination rates. The dataset shows what was filed, not what was declined. We hold any "this office declines more cases" framing pending paired data from law enforcement referrals.
- Office-level performance comparisons against case complexity. Solving for case-complexity differences would require detailed charge-severity weighting that this dataset does not support cleanly. Aggregate top-charges sections are published; complexity-adjusted comparisons are not.
Methodology
Data source. Virginia Online Case Information System (CIS) — the public court records published by the Virginia Judicial System. VirginiaCourtFile aggregates these records daily and presents them in structured form for analysis. Every record visible in this report is also visible to anyone with access to the same public court information.
Universe. Charges filed in Virginia Circuit Courts during calendar year 2025, across 119 of 122 reporting jurisdictions. The 19th Judicial Circuit (Fairfax County, Fairfax City, Falls Church) operates outside the statewide CIS via the Court Public Access Network, which prohibits automated collection. References to "statewide" in this report mean 30 of 31 judicial circuits.
Counting unit. Charges, not unique cases or defendants. One person can have multiple charges; one case can have multiple charges.
Office-level framing. This report presents data at the level of the Commonwealth's Attorney's office (a jurisdiction-level institution), not at the level of individual prosecutors. The Virginia Case Information System does not record the assistant Commonwealth's Attorney handling each case. Multiple ACAs work within each office; institutional patterns reflect the office as a whole, not any single prosecutor.
Volume bands. Per-jurisdiction analysis uses five volume bands based on 2025 filing counts (≥1,000 / 500–999 / 200–499 / 50–199 / <50). Different metrics are displayed at different bands to avoid small-N noise:
| Band | Filings | Display rule |
|---|---|---|
| A | ≥1,000 | All metrics with full rates |
| B | 500–999 | All metrics, with disclosure |
| C | 200–499 | Principal metrics only |
| D | 50–199 | Counts + filing-type %, narrow rates suppressed |
| E | <50 | Counts only; all rates suppressed |
Verification. Every numeric claim in this report is derived from public Virginia court records and was re-derived from source data on the publication date. Researchers seeking access to the underlying record set may contact us.
What this report does not capture
- Pre-filing decisions. Cases declined by the Commonwealth's Attorney before filing in court are not visible in this dataset.
- Plea-bargain negotiations. Informal charge negotiations occurring outside the formally-recorded Amended Charge field are not captured.
- Individual prosecutor performance. Which assistant Commonwealth's Attorney handled which case is not in the data.
- Causation. The data shows what happened, not why. Possible drivers of any pattern observed (office policy, charge mix, supervision caseloads, prior-conviction patterns, judicial preferences) are not individually observable.
- Severity within charges. A felony charge can be Class 1 through Class 6, with very different consequences. Aggregate counts hide this distinction.
- The 19th Judicial Circuit. Not in this dataset.
- Civil cases. This report covers Circuit Criminal Court only.
Editorial standards. This report observes; it does not recommend. Numbers are sourced and cited rather than editorialized. Findings that depend on data quality issues are either reframed at the appropriate level of aggregation or held from publication.
Drill into a specific office. Each of the 119 Commonwealth's Attorney offices has its own data page with charging-method mix, disposition breakdown, and trial activity in context of the statewide median. Browse all 119 offices →
For journalists: custom data pulls and fact-check support for stories building on this report are available through a research partnership. Free with citation.
Suggested citation: VirginiaCourtFile.com. (May 2026). Virginia Prosecutorial Accountability — 2025 Report. Retrieved from https://www.virginiacourtfile.com/research/virginia-prosecutorial-accountability-2025
Source: Virginia Online Case Information System (CIS), public Virginia Circuit Court records covering 119 of 122 reporting jurisdictions, calendar year 2025. Every published number was re-derived from source records on the publication date. Office-level framing — no individual prosecutor attribution.
Not legal advice. This report describes patterns in Virginia prosecutorial activity. Nothing here should be construed as legal advice or as a recommendation for any specific case, defendant, office, or proceeding.